Back to Categories
Question 1 of 11
Biology > human-welfare-biotech-and-ecology > Biodiversity And Conservation
Progress: 0%
Success Rate: 0%
Question 1
Study the data collected based on a survey conducted for species richness of groups of mammals in three different regions of the world, shown in the bar graph given below:
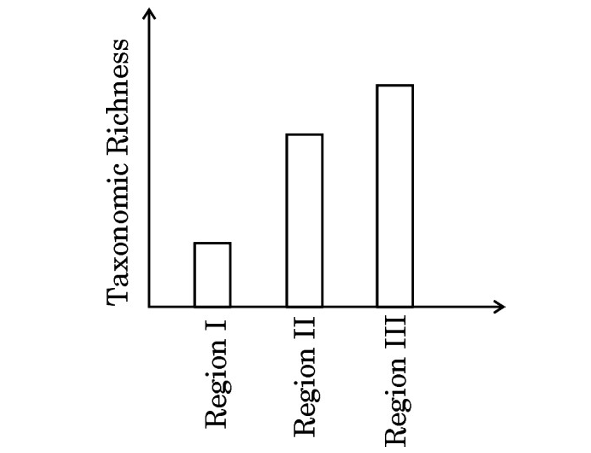
Why is the species richness minimum in Region I in the bar graph?
0 of 11 answered
Current Session
Questions Answered0
Correct Answers0
Session Success Rate0%
Ready to Start! 🚀
Community Stats
Active Learners30
Questions Attempted597
Community Success Rate70%
Track Your Progress
Sign up to save your practice progress and get personalized insights across all topics.